Design an "Alerting Module" in multi-tenant SaaS platform (5M devices).
Capturing application events

Currently, various application events (i.e. crash, load, usage) and device metrics (i.e. cpu, ram, and disk usage) are being ingested and aggregated into a database .
Customers are in need of a system where they can configure alerts on above events and metrics by defining some criteria to be alerted about every 15 min/1hour/24hour
FR
1.Continuosly monitor alert events like crashes, load times and device metrics (eg:ram, cpu usage,) from ingested data
2.Send alert on MS Teams crash and report device status
3. Send alert on page load time and report device and user status
4. Planned to have multiple channels of alert notifications, but the first one will be via Email.
NFR
1. System should be highly scalable for handling larges sets of data and alerts for 4M devices
2. Low latency:-Alert should be generated and sent with low latency,ensuring real time detection for critical issues 3.System should be highly available
Estimates
5M devices are there
Assume every device sends 5metrics /minutes
total events per minutes = 5M*5=25M
for per sec=25M/100 (rounding 60 to 100)=250000 events/sec
Alert rule calculation:-
Assume each device has 2 alert rules defined
and alert rules are evaluated every 15 mins
total alert evaluation=5M*2
per minutes alert evaluation= 5M*2/15
so TPS-5M*2/(15*60-900-1000)=10K TPS
API
1. For setting alert rules
POST api/v1/alert-rules

{
tenant_id,
alert_name: "Hihg CPU Usage" conditions:
{
metric:"cpu_usage",
operator: ">",
threshold:"90,
time_window:15m
}
notification_channel:["email"],
recipients:["abc@gmail.com"]
frequency:15m
}
response
{
status: "success",
alert_id:alert_12334
}
2. to get all alert rules for given tenant
GET/api/v1/alert-rules? tenant_id=tenant123
reponse
"alert_rules": [
{
{
"alert_id": "alert12345",
"alert_name": "High CPU Usage",
"condition": {
"metric": "cpu_usage",
"operator":"",
"threshold": 90,
"time_window": "15m"
},
"notification_channels": ["email"],
"status": "active"
}
1
}
3. Evaluate alert rules
POST api/v1/evaluate(internal API)
{
"evaluation_time": "2024-10-08T14:00:00Z"
}
reponse
{
"status": "success",
"evaluated_alerts": 200
}
4. To trigger notifcation
POST api/v1/notification/send
{
tenant_id,
alert_id,
alert_name:High cpu usage,
triggered_at:time
notification_channel:["email"],
recipients:[abc@gmail.com]
}

{
response
"status": "notification_sent",
"alert_id": "alert12345",
"recipients": ["admin@tenant.com"]
}
Data Models
Tenant table
{
tenant_id,(PK)
tenant_name,
email,
created_at, updated_at
}
Alert Table
{
alert_id,(PK)
tenant_id(FK)
alert_rule,
logical_operator(>,<,==....),
metric_name,
threshold,
frequency_of_alert_evaluate(eg every 10 min or 15 min)
notification_channel,
created_at,
status(active/disabled)
}
Metric Table
{
metric_id,
metric_name,
description,
created_at
}
Alert Evaluation Table
{
id,
alert_id(FK),
alert_trigggred (wether alert was triggred or not),
alert_evaluation: (when was alert evaluated),
created_at
}
Notification table
{
id(PK)
alert_id,(FK)
notification_channel,
sent_at,
status:[sent/failed]
}
Device table
{
id,
device_name,
status (active/disabled)
last_active_at
Event table
{
id,
tenant_id(FK),
device_id,
event_type,(app_crash,page_load_time),
event_timestamp,
description
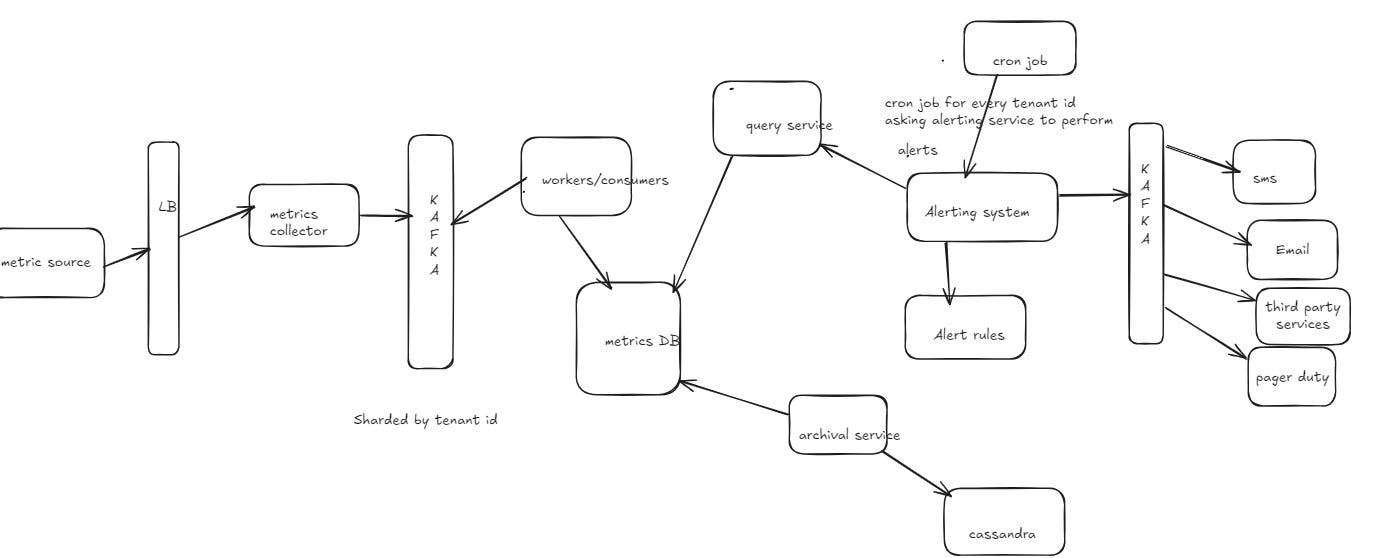
} High level Diagram