Design control plane for Distributed Database
Designing the control plane for a Distributed Database involves creating the central logic and coordination layer that manages and orchestrates the behavior of the underlying data nodes (data plane).

Let’s look into FR
1.Add/remove nodes (scale in/out)
2.Detect and handle node failures (health checks)
3.Track and assign data partitions/shards to nodes
4.Rebalance data on node addition/removal
5.Define and enforce replication factor
6.Manage leader/follower assignment per partition
7.Provide central configuration store for DB parameters
8.Propagate configuration changes to data nodes safely (with rollout strategies)
9.Access Control and Security like manage users, roles, and permissions
10.Collect and expose health metrics, load stats, replication lag, etc.
11.Upgrade and Deployment Orchestration like support rolling upgrades of nodes and configurations.
12.Backup and Restore Coordination like trigger consistent backups across nodes
13.API and CLI Interfaces like expose admin APIs for automation (e.g., REST/gRPC)
NFR
1.System should be highly scalable to manage clusters with thousands of nodes.
2.System should be highly available to like control plane must tolerate node failures (use leader election, quorum-based consensus).
3.Ensure strong consistency for metadata, cluster config, shard mappings, and leader election (linearizability).
4.Control plane operations like routing decisions, leader lookup, or metadata fetch should have low latency.
Estimates
We design for a production environment supporting:

10,000 nodes

100 shards per node → 1 million shards total

Replication factor = 3

Average 10 schema versions per table, and 10K tables

Metadata updates: ~10 ops/sec

Metadata lookups: ~10K ops/sec

Each metadata entry (shard mapping, config, schema, etc.): ~1 KB
1. Metadata Storage Requirements
a. Shard metadata:
1M shards × 1 KB = ~1 GB
b. Node metadata:
10K nodes × 1 KB = ~10 MB
c. Schema metadata:
10K tables × 10 versions × 1 KB = ~100 MB
d. Configuration, access control, replication info: ~500 MB (buffered estimate)
🟰 Total metadata footprint ≈ 2 GBAPI’s
1.Register Node
POST /cluster/nodes/register
request {
  "node_id": "node-101",
  "host": "10.1.2.3",
  "port": 7000,
  "zone": "us-east-1a"
}
response {
  "status": "success",
  "message": "Node registered",
  "node_id": "node-101"
}
2.List Nodes
GET /cluster/nodes
response {
  "nodes": [
    {
      "node_id": "node-101",
      "host": "10.1.2.3",
      "status": "HEALTHY",
      "shards": 80
    },
    {
      "node_id": "node-102",
      "host": "10.1.2.4",
      "status": "UNHEALTHY",
      "shards": 75
    }
  ]
}
3.Decommission Node
DELETE /cluster/nodes/{node_id}
{
  "status": "success",
  "message": "Node node-102 marked for decommission"
}
4.List All Shards
GET /shards
{
  "shards": [
    {
      "shard_id": "shard-001",
      "leader": "node-101",
      "replicas": ["node-101", "node-102", "node-103"]
    },
    {
      "shard_id": "shard-002",
      "leader": "node-104",
      "replicas": ["node-104", "node-105", "node-106"]
    }
  ]
}
5.Rebalance Shards
POST /shards/rebalance
{
  "status": "initiated",
  "rebalanced_shards": 122,
  "message": "Rebalancing in progress"
}
6.Move a Shard
request {
  "target_node_id": "node-110"
}
response {
  "status": "success",
  "message": "Shard shard-001 is being moved to node-110"
}
7.View Replication Config
{
  "replication_factor": 3,
  "strategy": "rack-aware"
}
8.Update Replication Config
request {
  "replication_factor": 5
}
response {
  "status": "success",
  "message": "Replication factor updated to 5"
}
9.Force Leader Election
request {
  "new_leader_node_id": "node-102"
}
response {
  "status": "success",
  "message": "Node node-102 is now leader for shard shard-001"
}
Database
🗃️ Control Plane Metadata Database
This is not the user’s data, but system metadata about the distributed database’s structure and health.
✅ Suggested Database:
PostgreSQL (or any strongly consistent RDBMS)
etcd or CockroachDB for consensus-backed state (for HA setups)
🧱 Schema Design (Control Plane Metadata)
Here’s a proposed schema layout:
1. Nodes Table
CREATE TABLE nodes (
    node_id VARCHAR PRIMARY KEY,
    host VARCHAR NOT NULL,
    port INT NOT NULL,
    zone VARCHAR,
    status VARCHAR CHECK (status IN ('HEALTHY', 'UNHEALTHY', 'DECOMMISSIONING')),
    last_heartbeat TIMESTAMP
);
2. Shards Table
CREATE TABLE shards (
    shard_id VARCHAR PRIMARY KEY,
    leader_node_id VARCHAR REFERENCES nodes(node_id),
    data_range_start BIGINT,
    data_range_end BIGINT,
    created_at TIMESTAMP DEFAULT now()
);
3. Shard Replicas Table
CREATE TABLE shard_replicas (
    shard_id VARCHAR REFERENCES shards(shard_id),
    node_id VARCHAR REFERENCES nodes(node_id),
    is_leader BOOLEAN DEFAULT FALSE,
    sync_status VARCHAR CHECK (sync_status IN ('IN_SYNC', 'LAGGING', 'OFFLINE')),
    PRIMARY KEY (shard_id, node_id)
);
4. Schemas Table (For user table schema tracking)
CREATE TABLE db_schemas (
    table_name VARCHAR,
    version INT,
    schema_json JSONB,
    created_at TIMESTAMP DEFAULT now(),
    PRIMARY KEY (table_name, version)
);
5. Cluster Configuration Table
CREATE TABLE cluster_config (
    config_key VARCHAR PRIMARY KEY,
    config_value TEXT,
    updated_at TIMESTAMP DEFAULT now()
);
6. Events / Audit Log (Optional)
CREATE TABLE control_plane_events (
    event_id SERIAL PRIMARY KEY,
    event_type VARCHAR,
    payload JSONB,
    created_at TIMESTAMP DEFAULT now()
);
7. Users & Access Control (Optional)
CREATE TABLE users (
    user_id SERIAL PRIMARY KEY,
    username VARCHAR UNIQUE,
    role VARCHAR,
    created_at TIMESTAMP DEFAULT now()
);
CREATE TABLE permissions (
    user_id INT REFERENCES users(user_id),
    resource VARCHAR,
    action VARCHAR,
    PRIMARY KEY (user_id, resource, action)
);
HLD
| Microservice              | Responsibility                                           |
| ------------------------- | -------------------------------------------------------- |
| **Node Manager**          | Register/monitor data nodes, heartbeats, health tracking |
| **Shard Manager**         | Shard creation, assignment, balancing, movement          |
| **Replication Manager**   | Replica management, leader election, sync status         |
| **Schema Manager**        | Track schema versions, apply updates                     |
| **Topology Service**      | Maintain cluster-wide shard-node mappings                |
| **Metadata Store**        | Abstraction layer for underlying DB (Postgres, etcd)     |
| **Admin API Gateway**     | Expose REST/gRPC APIs to clients/admin tools             |
| **Security & Auth**       | RBAC, token management, audit logging                    |
| **Event Processor**       | Background jobs (e.g., rebalance, failover triggers)     |
| **Observability Service** | Metrics, logs, health dashboards, alerting               |
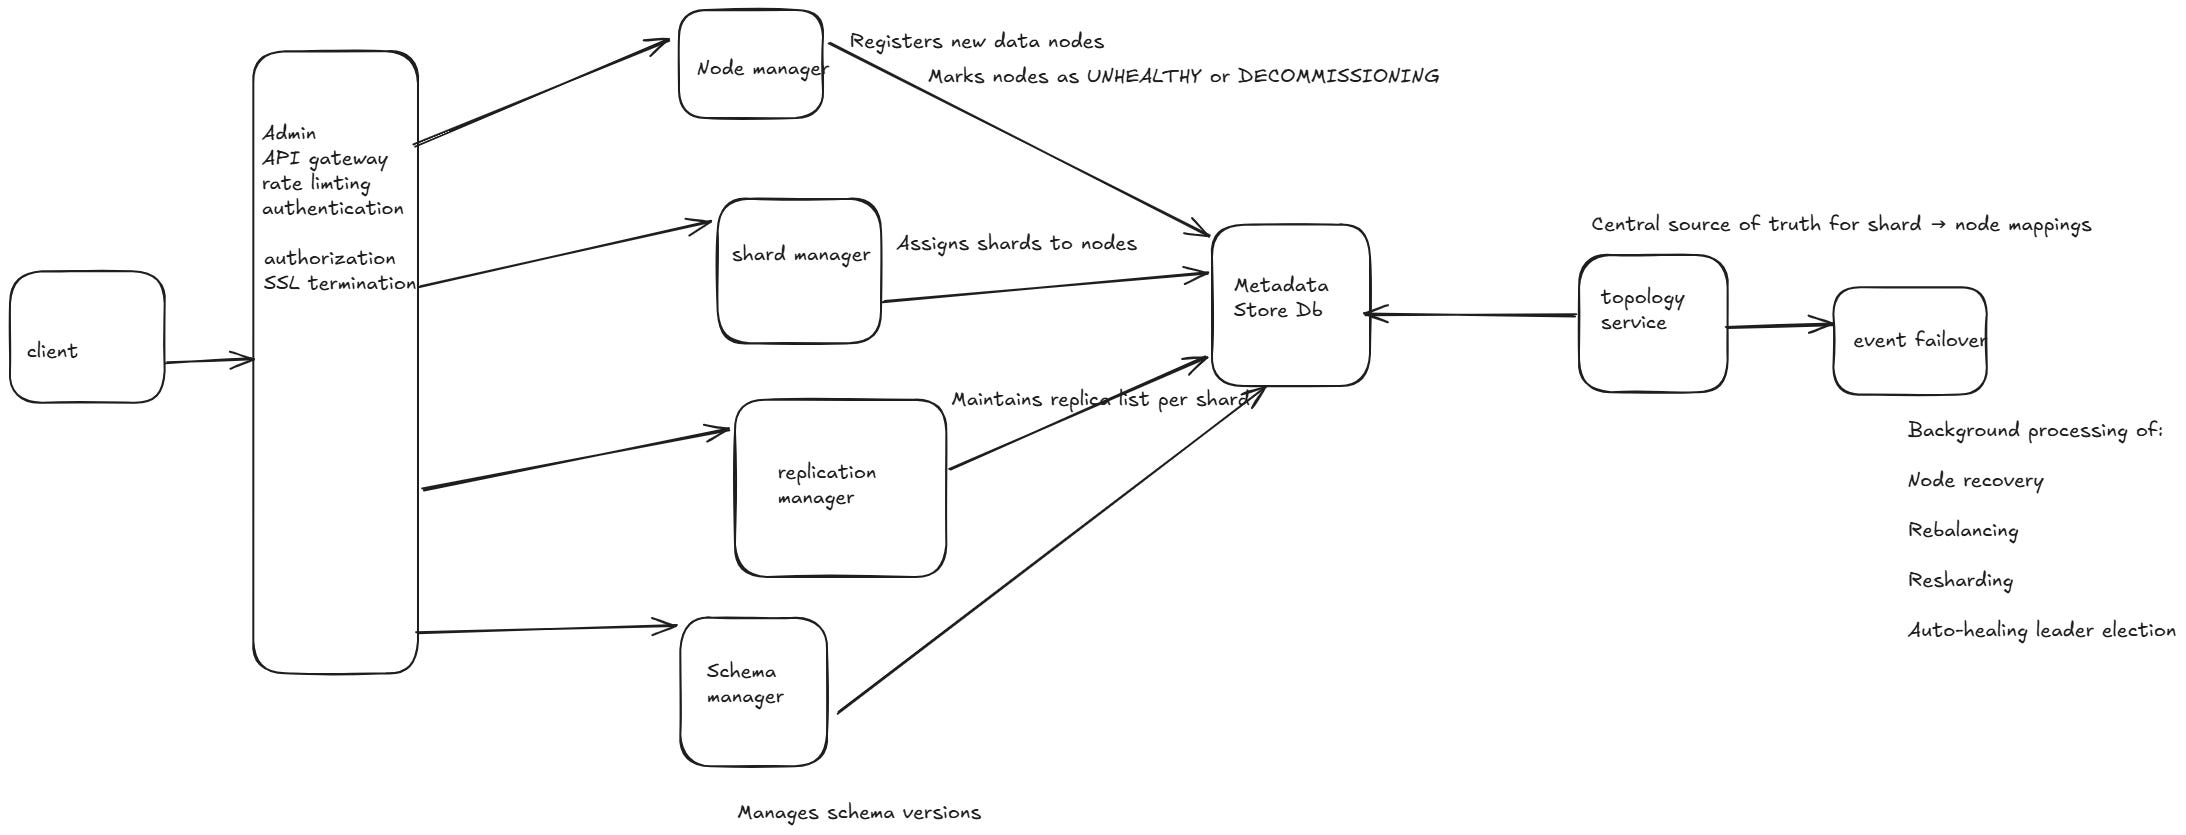
🔁 Interaction Diagram (Textual View)
            +-----------------------+
            |   Admin API Gateway   |
            +-----------------------+
                      |
    +-----------------+-------------------+
    |         |           |             |
    v         v           v             v
+--------+ +---------+ +-----------+ +-------------+
| Node   | | Shard   | | Replication| | Schema      |
|Manager | |Manager  | | Manager    | | Manager     |
+--------+ +---------+ +-----------+ +-------------+
    \         |           |             /
     \        v           v            /
      +--------------------------------+
      |       Metadata Store (DB)      |
      |  (Postgres / etcd / Raft)      |
      +--------------------------------+
                     |
               +------------+
               | Topology   |
               |  Service   |
               +------------+
                     |
               +------------+
               | Event /    |
               | Failover   |
               +------------+
🧩 Microservice Details
1. Node Manager
Registers new data nodes
Monitors health via heartbeats
Marks nodes as
UNHEALTHYorDECOMMISSIONING
2. Shard Manager
Assigns shards to nodes
Handles rebalance and scaling events
Coordinates with Topology & Replication Manager
3. Replication Manager
Maintains replica list per shard
Triggers leader elections
Sync status check between leader/followers
4. Schema Manager
Manages schema versions
Provides compatibility validation for updates
Supplies schemas to clients on demand
5. Topology Service
Central source of truth for shard → node mappings
Responds to routing and lookup queries
Cached locally by services and updated on change
6. Metadata Store
Common abstraction for data persistence
Uses Raft/etcd for consistency if needed
Exposes atomic read/write ops
7. Admin API Gateway
Exposes unified APIs (REST/gRPC) to admin tools
Handles rate limiting, authentication, and routing
8. Security & Auth
Token-based authentication (e.g., JWT)
Role-based access control for all APIs
Logs all access and changes (audit trail)
9. Event Processor / Failover Service
Background processing of:
Node recovery
Rebalancing
Resharding
Auto-healing leader election
10. Observability Service
Exposes metrics (Prometheus, OpenTelemetry)
Tracks cluster, node, shard, and replication health
Integrates with dashboards like Grafana
🔐 Communication Style
Internal comms: gRPC (performance, contracts)
External APIs: REST (admin dashboard, CLI)
Event triggers: Message queue (Kafka/NATS) for async operations (e.g., node failure handling)