Design distributed logging and monitoring
Let's look into FR

FR
1.Support logs from applications, system services, databases, and cloud providers
2.Collect logs in real-time for live monitoring and alerting.
3.Query logs using service name, log level, error codes, or trace IDs
4.Trigger alerts on high error rates, service failures, or security breaches.
5.Provide real-time dashboards using Grafana, Kibana, or Prometheus.
NFR
1.System should be highly scalable to handle Millions of Logs per Second
2.Ingestion latency <100ms, ensuring near real-time monitoring.
3.Query latency <1s for recent logs using optimized indexing & caching (Redis, Elasticsearch).
4.System should be eventual consistent
5.System should be highly available
Estimates
QPS=1Mlogs/sec
Storage=
API’s
1.POST /api/v1/logs
request {
  "timestamp": 1710859200,
  "level": "ERROR",
  "service": "payment-service",
  "hostname": "server-01",
  "trace_id": "abc123-xyz456",
  "message": "Payment gateway timeout",
  "metadata": {
    "user_id": "5678",
    "transaction_id": "txn-91234"
  }
}
response {
  "status": "success",
  "message": "Log received"
}
2.GET /api/v1/logs/search
response {
  "logs": [
    {
      "timestamp": 1710859100,
      "level": "ERROR",
      "service": "payment-service",
      "hostname": "server-01",
      "trace_id": "abc123-xyz456",
      "message": "Payment gateway timeout",
      "metadata": {
        "user_id": "5678",
        "transaction_id": "txn-91234"
      }
    }
  ]
}
3.GET /api/v1/logs/aggregate
response{
  "aggregations": {
    "payment-service": 150,
    "order-service": 320,
    "auth-service": 80
  }
}
4.POST /api/v1/alerts
request {
  "service": "payment-service",
  "condition": {
    "field": "level",
    "operator": "==",
    "value": "ERROR"
  },
  "threshold": 100,
  "time_window": "5m",
  "notification": {
    "type": "slack",
    "channel": "#alerts"
  }
}

resposne {
  "status": "success",
  "alert_id": "alert-5678"
}
5.POST /api/v1/logs/retention
request {
  "service": "payment-service",
  "hot_storage_days": 7,
  "cold_storage_days": 180
}
response {
  "status": "success",
  "message": "Retention policy updated"
}
6.GET /api/v1/system/health
response {
  "status": "healthy",
  "ingestion_rate": "950K logs/sec",
  "storage_utilization": "72%",
  "query_latency": "800ms",
  "alerting_queue_size": 15
}
DB Schema
1. Log Storage Table (PostgreSQL / ClickHouse / Cassandra)
Stores structured metadata while log messages are indexed separately in Elasticsearch.
CREATE TABLE logs (
    log_id UUID PRIMARY KEY DEFAULT gen_random_uuid(),
    timestamp TIMESTAMP NOT NULL DEFAULT NOW(),
    service_name VARCHAR(255) NOT NULL,
    log_level VARCHAR(10) CHECK (log_level IN ('DEBUG', 'INFO', 'WARN', 'ERROR', 'FATAL')),
    trace_id UUID NULL,
    span_id UUID NULL,
    hostname VARCHAR(255) NOT NULL,
    message TEXT NOT NULL,
    metadata JSONB NULL,
    indexed BOOLEAN DEFAULT FALSE,
    storage_path TEXT NULL
);

-- Indexes for efficient querying
CREATE INDEX idx_logs_timestamp ON logs(timestamp);
CREATE INDEX idx_logs_service_name ON logs(service_name);
CREATE INDEX idx_logs_log_level ON logs(log_level);
CREATE INDEX idx_logs_trace_id ON logs(trace_id);
2. Log Indexing (Elasticsearch)
Since Elasticsearch is NoSQL, we define the JSON mapping instead of SQL schema.
{
  "mappings": {
    "properties": {
      "log_id": { "type": "keyword" },
      "timestamp": { "type": "date" },
      "service_name": { "type": "keyword" },
      "log_level": { "type": "keyword" },
      "trace_id": { "type": "keyword" },
      "span_id": { "type": "keyword" },
      "hostname": { "type": "keyword" },
      "message": { "type": "text" },
      "metadata": { "type": "object" }
    }
  }
}
3. Log Aggregation Table (ClickHouse / PostgreSQL)
Stores precomputed log metrics for faster analytics.
CREATE TABLE log_aggregates (
    aggregation_id UUID PRIMARY KEY DEFAULT gen_random_uuid(),
    time_window TIMESTAMP NOT NULL,
    service_name VARCHAR(255) NOT NULL,
    log_level VARCHAR(10) CHECK (log_level IN ('DEBUG', 'INFO', 'WARN', 'ERROR', 'FATAL')),
    log_count BIGINT NOT NULL
);

-- Indexes for fast group-by queries
CREATE INDEX idx_aggregates_time ON log_aggregates(time_window);
CREATE INDEX idx_aggregates_service ON log_aggregates(service_name);
4. Alert Rules Table (PostgreSQL)
Stores alerting conditions for monitoring.
CREATE TABLE alerts (
    alert_id UUID PRIMARY KEY DEFAULT gen_random_uuid(),
    service_name VARCHAR(255) NOT NULL,
    condition_field VARCHAR(50) NOT NULL,
    condition_operator VARCHAR(10) CHECK (condition_operator IN ('==', '!=', '<', '>', '<=', '>=')),
    condition_value TEXT NOT NULL,
    threshold INT NOT NULL,
    time_window INTERVAL NOT NULL,
    notification_type VARCHAR(20) CHECK (notification_type IN ('email', 'slack', 'pagerduty')),
    notification_target TEXT NOT NULL
);

-- Index for fast lookups
CREATE INDEX idx_alerts_service ON alerts(service_name);
Can We Use Agents and Collectors Instead of a Message Queue?
Yes, instead of using a message queue (Kafka, RabbitMQ, SQS), we can use agents and collectors to handle log ingestion and forwarding efficiently. This approach is often used in observability platforms like Fluentd, Logstash, and OpenTelemetry.
💡 What Are Agents & Collectors?
Agents: Installed on application servers, agents collect logs and forward them to collectors.
Collectors: Centralized services that process, filter, and store logs in databases or search engines.
✅ Advantages Over Message Queues
✔ Lower operational overhead (No Kafka/RabbitMQ cluster maintenance).
✔ Real-time streaming with minimal delay.
✔ More control over log filtering and enrichment at the agent level.
✔ Lightweight & scalable since agents directly forward logs to collectors.
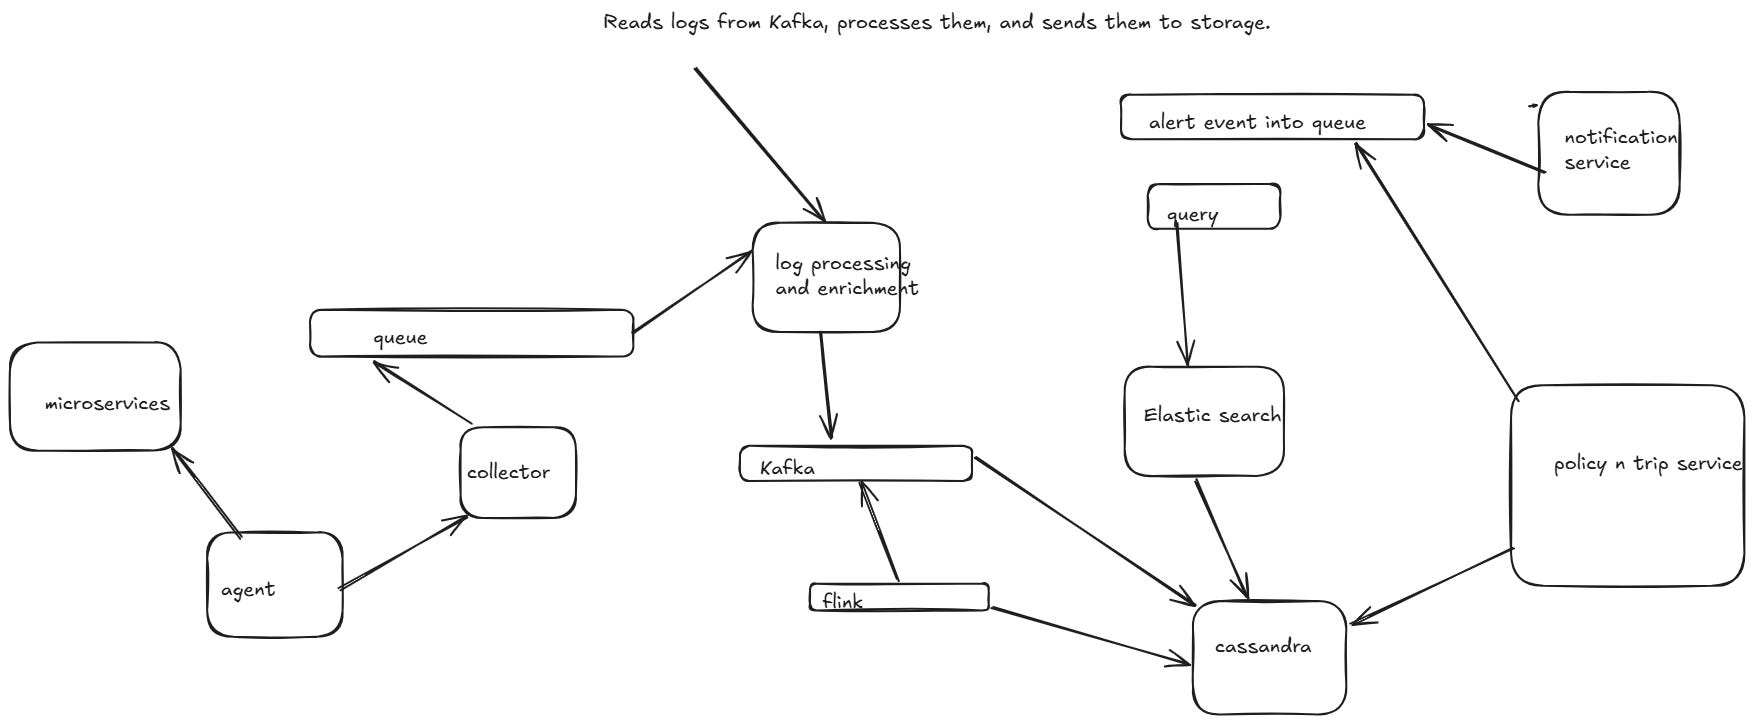
🔄 Alternative Architecture Using Agents & Collectors
1️⃣ Log Agents (Fluent Bit, Filebeat, OpenTelemetry Agent)
Installed on each service instance to collect logs from applications.
Reads logs from files, stdout, or structured logs (JSON, Protobuf, etc.).
Applies preprocessing, filtering, and enrichment before forwarding logs.
2️⃣ Log Collectors (Fluentd, Logstash, OpenTelemetry Collector)
Aggregates logs from multiple agents.
Normalizes logs (adds metadata, trace IDs, timestamps).
Forwards logs to Elasticsearch, ClickHouse, or S3 for long-term storage.
3️⃣ Storage & Query System
Elasticsearch → Full-text search.
ClickHouse / PostgreSQL → Structured log storage.
S3 / HDFS → Long-term archival.
HLD