Design Google analytics-User Analytics,Dashboard and Pipeline
Designing a Google Analytics-like User Analytics System involves multiple components, including a User Analytics Engine, a Dashboard, and a Data Processing Pipeline

FR
Collect events like page views, clicks, conversions, session starts, and exits.
Support tracking across web, mobile, and third-party integrations (via SDKs).
Capture user metadata (e.g., device, location, IP, browser, OS).
Support custom event tracking (e.g., checkout completion, ad clicks).
Assign unique user/session identifiers for tracking behavior over time.
Handle bot filtering and deduplication of duplicate events.
Support real-time and batch event ingestion
Sessions, bounce rate, active users, retention rate, engagement time.
Real-time Analytics: Live session tracking, active users, event triggers.
Collect data from SDKs (JavaScript, Android, iOS) via REST/gRPC.
NFR
1.System should be highly scalable to handle millions of events per second at peak load
2.Event Ingestion Latency: Must be <100ms for real-time data ingestion.
3.Real-time metrics should be updated within 1-5 seconds.
4.System should be highly available and reliable
5.System should be consistent .It should have exactly-once semantics for processed analytics data to avoid duplication.
6.System should be fault tolerant
Estimates
100M daily active users (DAUs)

Each user generates 50 events per session

On average, 2 sessions per user per day
Total daily events = 100M×2×50=10B (10 billion events per day)
QPS=10B/10^5=10^5 QPS
Storage
Assumptions per event:

Event ID: 16 bytes

Timestamp: 8 bytes

User ID: 16 bytes

Event Type: 8 bytes

Metadata (device, location, referrer, etc.): 200 bytes

Total per event: ~250 bytes

Total storage= 10B*250bytes= 2.5TB/day
API’s
1.POST /v1/events/ingest
Collects user events from frontend clients.
request {
  "user_id": "abc-123",
  "session_id": "sess-456",
  "timestamp": 1711234567890,
  "event_name": "page_view",
  "metadata": {
    "page_url": "https://example.com/home",
    "referrer": "https://google.com",
    "device": "mobile",
    "browser": "Chrome",
    "location": "US"
  }
}
response { "status": "success", "event_id": "evt-789" }
2.POST /v1/events/bulk-ingest
Used for sending multiple events at once.
request
{
  "events": [
    { "user_id": "abc-123", "event_name": "page_view", "timestamp": 1711234567890, "metadata": {} },
    { "user_id": "abc-123", "event_name": "click", "timestamp": 1711234567990, "metadata": {} }
  ]
}

response { "status": "success", "processed_events": 2 }
3.GET /v1/analytics/active-users?time_window=5m
response { "active_users": 12000 }
4.GET /v1/analytics/sessions?start=1711230000&end=1711239999
Returns session counts and bounce rates for a time range.
{
  "total_sessions": 500000,
  "bounce_rate": 45.3
}
5.POST /v1/analytics/funnel
request {
  "steps": ["homepage", "product_page", "cart", "checkout"],
  "start_time": 1711230000,
  "end_time": 1711239999
}
response {
  "steps": ["homepage", "product_page", "cart", "checkout"],
  "start_time": 1711230000,
  "end_time": 1711239999
}
6.POST /v1/analytics/query
request { "query": "SELECT COUNT(*) FROM events WHERE event_name='purchase' AND timestamp BETWEEN 1711230000 AND 1711239999" }
reponse { "result": 32000 }
7.POST /v1/dashboards
request {
  "name": "E-commerce Performance",
  "widgets": [
    { "type": "line_chart", "query": "SELECT timestamp, COUNT(*) FROM events WHERE event_name='purchase' GROUP BY timestamp" },
    { "type": "pie_chart", "query": "SELECT device, COUNT(*) FROM events GROUP BY device" }
  ]
}
reponse { "dashboard_id": "dash-123", "status": "created" }
8.POST /v1/auth/login
request { "email": "user@example.com", "password": "hashed-password" }
response { "token": "jwt-token", "expires_in": 3600 }
Databases
Schema Design for Different Databases
1. Raw Event Storage (Kafka, S3, HDFS)
This stores all events before processing.
Kafka Topic Schema (events_topic)
{
  "event_id": "evt-123",
  "user_id": "usr-456",
  "session_id": "sess-789",
  "event_name": "page_view",
  "timestamp": 1711234567890,
  "metadata": {
    "page_url": "https://example.com",
    "referrer": "https://google.com",
    "device": "mobile",
    "browser": "Chrome",
    "location": "US"
  }
}
S3 / HDFS Storage (Raw Event Files)
Partitioned by date/hour for efficient querying.
File format: Parquet or Avro.
Folder Structure:
s3://analytics-events/{year}/{month}/{day}/{hour}/events.parquet
2. Processed Event Storage (Apache Druid / ClickHouse)
Stores pre-aggregated data for fast querying.
Schema is columnar for OLAP workloads.
Table: aggregated_events (Druid / ClickHouse)
CREATE TABLE aggregated_events (
    event_date Date,
    event_hour UInt8,
    event_name String,
    user_count UInt64,
    session_count UInt64,
    device String,
    country String
) ENGINE = MergeTree()
PARTITION BY toYYYYMMDD(event_date)
ORDER BY (event_date, event_name, country);
Partitioning by date improves query performance.
Indexed columns:
event_name,country,devicefor fast lookups.
3. User Management (PostgreSQL / MySQL)
Stores user profiles, authentication tokens, and roles.
Table: users
CREATE TABLE users (
    user_id UUID PRIMARY KEY,
    email VARCHAR(255) UNIQUE NOT NULL,
    password_hash VARCHAR(255) NOT NULL,
    created_at TIMESTAMP DEFAULT NOW()
);
user_roles
CREATE TABLE user_roles (
    user_id UUID REFERENCES users(user_id),
    role VARCHAR(50) CHECK (role IN ('admin', 'viewer', 'editor')),
    PRIMARY KEY (user_id, role)
);
4. Dashboard Configuration (PostgreSQL / DynamoDB)
Stores user-created dashboards and their queries.
Table: dashboards
CREATE TABLE dashboards (
    dashboard_id UUID PRIMARY KEY,
    user_id UUID REFERENCES users(user_id),
    name VARCHAR(255),
    created_at TIMESTAMP DEFAULT NOW()
);
CREATE TABLE dashboard_widgets (
    widget_id UUID PRIMARY KEY,
    dashboard_id UUID REFERENCES dashboards(dashboard_id),
    type VARCHAR(50) CHECK (type IN ('line_chart', 'bar_chart', 'table', 'funnel')),
    query TEXT
);
5. Query Logs (DynamoDB / PostgreSQL)
Stores executed queries and their results.
DynamoDB Table: query_logs
{
  "query_id": "query-789",
  "user_id": "usr-456",
  "query_text": "SELECT COUNT(*) FROM events WHERE event_name='purchase'",
  "executed_at": "2024-03-29T12:34:56Z",
  "result_cache": { "count": 32000 }
}
Conclusion
Kafka & S3 for raw event storage.
Druid / ClickHouse for fast OLAP queries.
PostgreSQL / DynamoDB for user & dashboard data.
Schema optimizations include time-based partitioning, columnar storage, and indexed queries
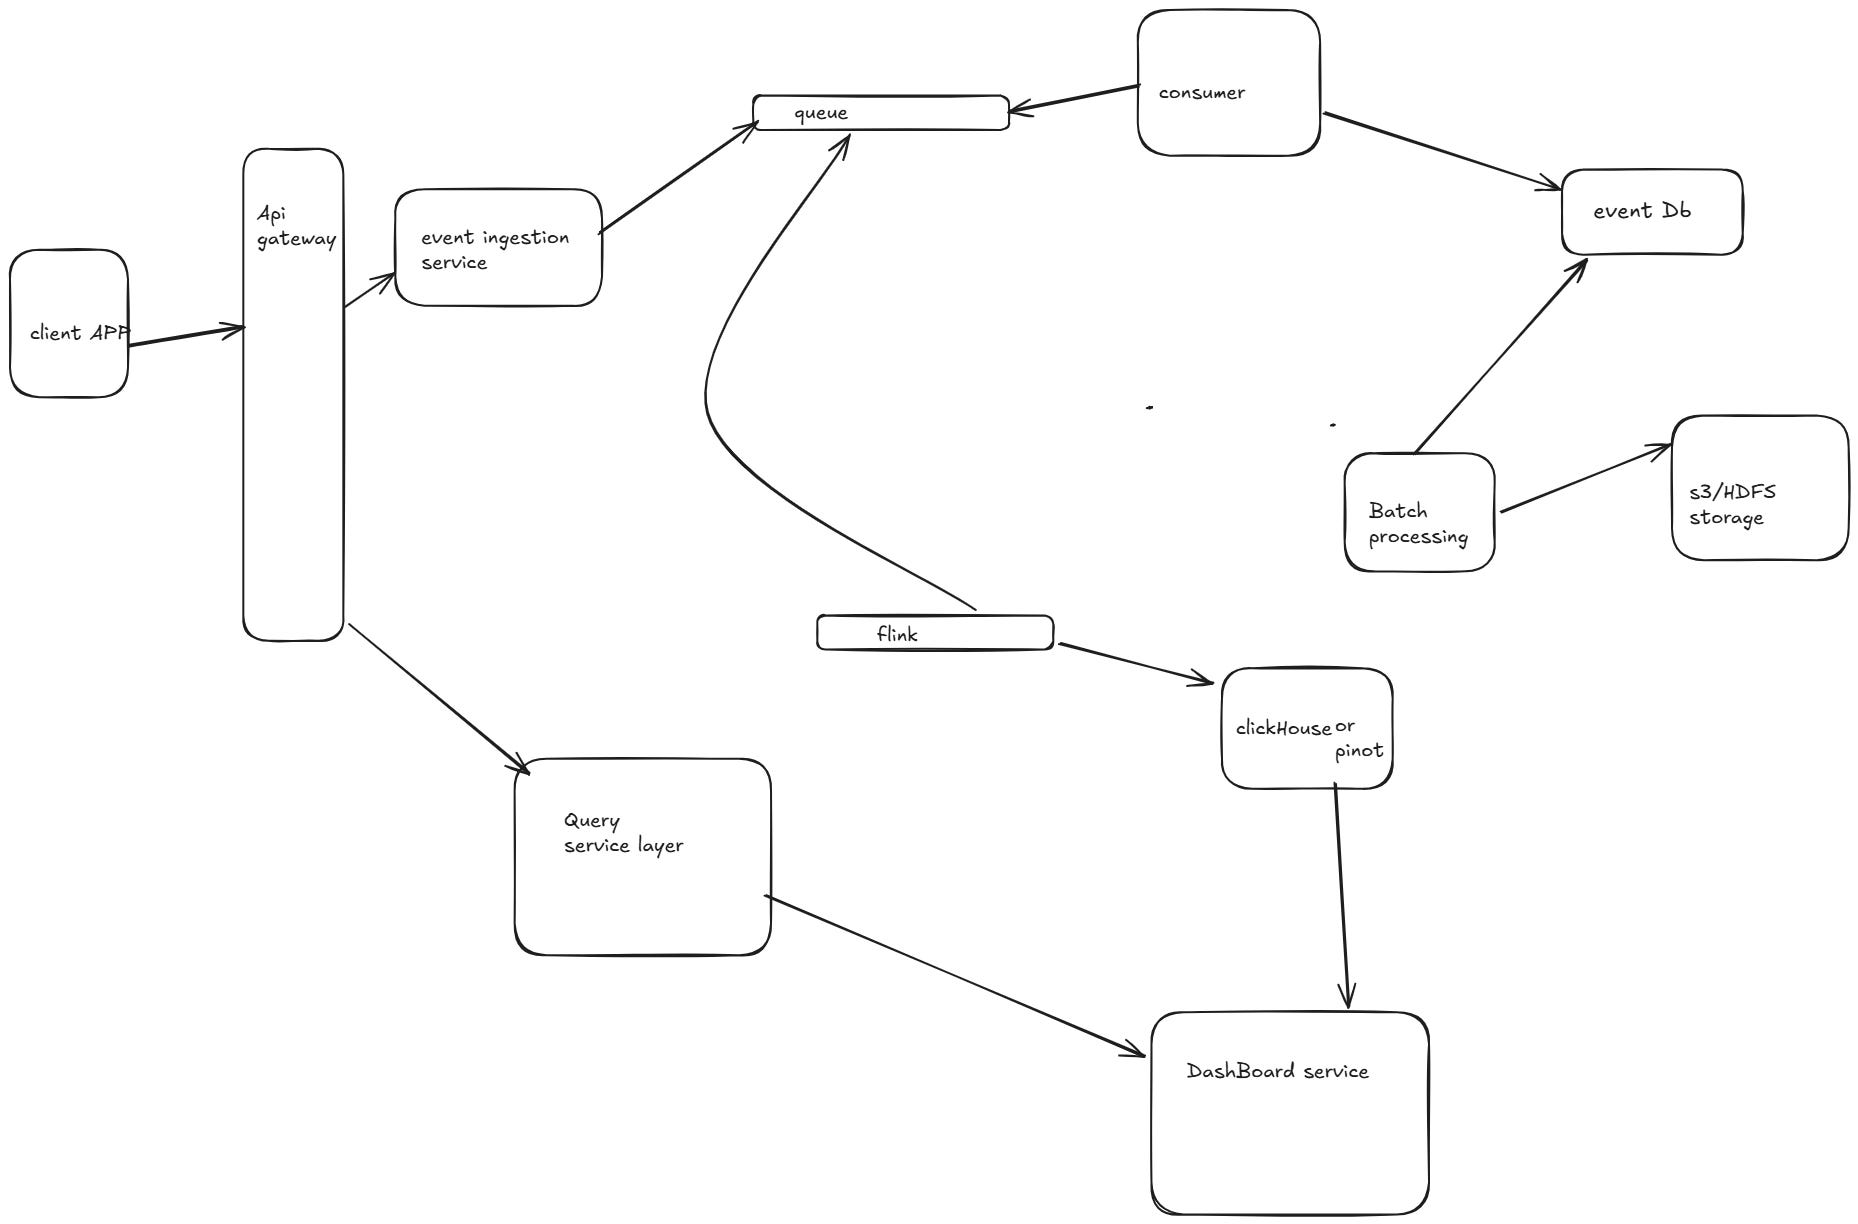
Microservices for Google Analytics-Like System
A Google Analytics-like system requires multiple microservices to handle event ingestion, processing, storage, querying, and visualization. Below is a breakdown of the microservices architecture and their interactions.
. Microservices Interaction Flow
Event Flow (Ingestion to Storage)
Clients (Web/Mobile) → Event Ingestion Service
Users trigger events (e.g., page views, clicks).
Events are sent to the Event Ingestion Service via REST API or gRPC.
Event Ingestion Service → Kafka
The ingestion service pushes events to Kafka topics.
Events are partitioned based on
user_idorsession_idfor scalability.
Event Processing Service → Druid / ClickHouse
Reads data from Kafka, applies aggregation and filtering, and pushes real-time data into Druid/ClickHouse.
Batch Processing Service → S3 / HDFS
Periodically processes raw logs and stores them in cold storage for historical analysis.
Query & Dashboard Flow
User Requests Dashboard Data
The Dashboard Service sends a query request to the Query Service.
If the query is real-time, it's executed on Druid / ClickHouse.
If it's a historical query, the Batch Processing Service fetches data from S3 / HDFS.
Query Service → Cached Response
If the query is frequently used, results are fetched from Redis cache instead of querying the database.
Dashboard Service → Frontend
The Dashboard Service formats the response and sends it to the frontend for rendering.
Authentication & User Management Flow
User Logs In (Authentication Service)
The Auth Service verifies credentials via OAuth2 / JWT.
The user’s role (
admin,viewer,editor) is validated.
User Accesses Data (RBAC Enforcement)
The Query Service checks the user’s role before executing queries.
Alerting & Notifications Flow
User Defines Alerts
The Notification Service subscribes to important event patterns (e.g., sudden drop in traffic).
Real-Time Alerts Sent
When a condition is met, the Notification Service sends alerts via WebSockets, emails, or push notifications.
┌──────────────────────┐
│  Client Apps (Web/Mobile) │
└────────▲───────────┘
         │
         ▼
┌──────────────────────────┐
│ Event Ingestion Service  │
└────────▲───────────┘
         │
         ▼
┌──────────────────────────┐
│       Kafka Topic        │
└────────▲───────────┘
         │
         ▼
┌────────────────────────────┐   ┌────────────────────────┐
│ Real-Time Processing (Flink) │→│ Druid / ClickHouse    │
└────────────────────────────┘   └────────────────────────┘
         │
         ▼
┌──────────────────────────┐
│ Batch Processing (Spark) │
└────────▲───────────┘
         │
         ▼
┌──────────────────────┐
│  S3 / HDFS Storage   │
└──────────────────────┘
         │
         ▼
┌────────────────────────────┐
│ Query Service / API Layer  │
└────────▲───────────┘
         │
         ▼
┌──────────────────────────┐
│   Dashboard Service      │
└────────▲───────────┘
         │
         ▼
┌──────────────────────┐
│  Notification Service│
└──────────────────────┘
Event Ingestion → Kafka → Processing (Flink/Spark) → Storage (Druid/S3) → Querying (ClickHouse/Druid) → Dashboards.
Authentication, Notifications, and Reporting handled as separate microservices.
Real-time data in Druid/ClickHouse, and historical data in S3/HDFS for efficient querying.
HLD