Given a sensor package with 1 million sensors design a system to display a heat map to a team of farmers, What info do you expect the sensors to give, how freq, and how will you store it.
Let's look into FR

FR
1.The system must ingest real-time data from 1 million distributed sensors.
2.Each sensor may represent a spatial location on farmland.
3.The system must generate and update a visual heatmap (e.g., temperature, humidity, soil moisture) over a geographical map.
4.Allow users to view past heatmaps for a selected date/time range for analysis.
5.Support multiple farmers with access control to view relevant regions or data (multi-tenancy).
6.Notify when a sensor is offline, sending erroneous data, or has degraded performance.
7.Aggregate data across grid cells or zones (e.g., 10m x 10m or 100m x 100m), not show every raw point for performance.
NFR
1.The system must handle 1 million sensors, each sending data every minute (~16.7K events/sec).
2.Must scale horizontally to support increased sensor counts or higher frequency (e.g., every 10 seconds).
3.Heatmap generation and rendering should scale with the size of the area and zoom level.
4.Target 99.9% availability for the heatmap dashboard and APIs.
5.System should tolerate failures in sensor input, storage nodes, or network without impacting the user experience.
6.Sensor data should be ingested and reflected in the heatmap within 5–10 seconds (near real-time).
7.Heatmap load time (for real-time or historical views) should be <1 second for common zoom levels.
Estimates
📌 Assumptions
1 million sensors
Each sensor reports once per minute
Each report contains:
Sensor ID
Timestamp
Location (lat, long or cell ID)
3–5 metrics (e.g., temp, moisture, humidity, pH)
~200 bytes of data per report
✅ 1. Ingestion Load (QPS)
Sensors per minute:
= 1,000,000 reports/minute
= 1,000,000 / 60 ≈ 16,666 reports/sec (QPS)
If sensors report every 10 seconds (future scale):
= 1,000,000 / 10 = 100,000 QPS
✅ 2. Data Size Per Day
Per report size: ~200 bytes
Total per minute = 1,000,000 × 200B = 200 MB/minute
Total per hour   = 200 MB × 60 = 12 GB/hour
Total per day    = 12 GB × 24 = 288 GB/day
= 288 GB/day × 7 ≈ 2 TB for 7 days

= 288 GB/day × 365 ≈ 105 TB/year
✅ 3. Heatmap Processing
Assume we show a grid-based heatmap with tiles (e.g., 100m x 100m cells):
Let's say we have ~100K distinct spatial cells
For each cell, we compute aggregates (avg/min/max) per metric over 1-min windows
This processing involves:
17K events/sec → routed to correct cell aggregator (using stream processing)
With Apache Flink/Spark Streaming or Kafka Streams:
Each stream worker might process ~2K–5K events/sec
So need ~4–10 processing nodes at base scale
✅ 4. API QPS
Assume:
1K farmers using the dashboard concurrently
Dashboard polls every 30 seconds for new data
API QPS for dashboard:
= 1000 users / 30s ≈ 33 QPS
✅ 1. Sensor Data Ingestion APIs
These would typically be internal, often over MQTT/HTTP or via Kafka ingestion.
POST /api/v1/sensors/data
Description: Receives data from sensors.
Payload:
request = {
  "sensor_id": "sensor-abc-123",
  "timestamp": "2025-05-29T10:45:00Z",
  "location": { "lat": 21.21, "lon": 78.12 },
  "metrics": {
    "temperature": 32.1,
    "humidity": 54.3,
    "soil_moisture": 0.18,
    "ph": 6.5
  }
}
response { "status": "accepted" }
✅ 2. Heatmap APIs (Farmer UI-facing)
GET /api/v1/heatmap/current
Description: Fetches the current heatmap for a selected region.
Query Params:
region_idorlat,lon,zoom_levelmetrics(e.g.,temperature,humidity)aggregation(e.g.,avg,min,max)
{
  "timestamp": "2025-05-29T10:45:00Z",
  "cells": [
    {
      "cell_id": "geo_abc123",
      "location": { "lat": 21.2105, "lon": 78.1223 },
      "metrics": { "temperature": 31.9, "humidity": 53.2 }
    },
    ...
  ]
}
GET /api/v1/heatmap/history
Description: Get heatmap data for a region and time range.
Query Params:
region_idfrom=2025-05-28T00:00:00Zto=2025-05-28T12:00:00Zmetrics=soil_moistureinterval=15m(aggregation granularity)
Response:
Array of time buckets with aggregated values per cell.
✅ 3. Sensor Management APIs
GET /api/v1/sensors/:sensor_id/status
Description: Get sensor health (online/offline, last heartbeat, error rate).
Response:
{
  "sensor_id": "sensor-abc-123",
  "last_seen": "2025-05-29T10:43:00Z",
  "status": "online",
  "battery_level": 78,
  "data_latency_sec": 5
}
GET /api/v1/sensors/:sensor_id/data
Description: Fetch raw or processed data from a single sensor (for debugging or diagnostics).

Query Params:

from, to, metrics
✅ 4. User & Access APIs
POST /api/v1/auth/login
Standard JWT-based login for farmer/team access.
GET /api/v1/users/me/regions
Get regions or farms the user is allowed to view.
Optional Admin APIs
If sensors are managed by you:
POST /api/v1/sensors/registerPATCH /api/v1/sensors/:id/configDELETE /api/v1/sensors/:id
🧭 Notes on Implementation
APIs for heatmap should be backed by pre-aggregated tiles (e.g., per region and zoom level).
Use GeoHash or QuadTree to index and aggregate data spatially.
Secure all APIs with JWT, RBAC scopes (e.g.,
farmer.read.heatmap,admin.sensor.config).For high-performance heatmap delivery, consider GraphQL or WebSocket streaming if live updates are needed.
Databases and Schema
✅ Recommended Databases
1. Time-Series Database (Hot Data)
For fast access to recent sensor data and real-time aggregation.
✅ TimescaleDB (PostgreSQL extension)
Alternatives: InfluxDB, Apache Druid, or ClickHouse
2. Object Store / Data Lake (Cold Data)
For long-term historical storage and large-scale analytical queries.
✅ Amazon S3 + Parquet format
Query with Athena, Presto, or Spark
3. Relational DB for Metadata and Access Control
✅ PostgreSQL (or any SQL DB)
Stores user data, sensor registry, region mappings, etc.
✅ Schema Design
📊 1. sensor_data (Time-series DB)
Stores raw or aggregated metric readings.
CREATE TABLE sensor_data (
    sensor_id TEXT,
    timestamp TIMESTAMPTZ NOT NULL,
    lat DOUBLE PRECISION,
    lon DOUBLE PRECISION,
    geohash TEXT,
    temperature REAL,
    humidity REAL,
    soil_moisture REAL,
    ph REAL,
    PRIMARY KEY(sensor_id, timestamp)
);
-- In TimescaleDB: create hypertable on (timestamp)
🔹 Indexes:
(timestamp)(geohash, timestamp)for heatmap tile lookupsUse continuous aggregates for 1-min, 5-min summaries
📦 2. aggregated_tiles (Precomputed heatmap tiles)
Optional table for precomputed tiles (per grid per time window)
CREATE TABLE aggregated_tiles (
    tile_id TEXT,           -- could be a geohash or cell ID
    start_time TIMESTAMPTZ, -- 1-min or 5-min window
    metric_name TEXT,       -- e.g. temperature
    avg_value REAL,
    min_value REAL,
    max_value REAL,
    num_sensors INT,
    PRIMARY KEY(tile_id, start_time, metric_name)
);
🧭 3. sensors (Metadata - SQL DB)
CREATE TABLE sensors (
    sensor_id TEXT PRIMARY KEY,
    region_id TEXT,
    lat DOUBLE PRECISION,
    lon DOUBLE PRECISION,
    registered_at TIMESTAMPTZ,
    status TEXT,           -- online/offline
    last_seen TIMESTAMPTZ,
    battery_level INT,
    sensor_type TEXT
);
👥 4. users and user_regions
CREATE TABLE users (
    user_id UUID PRIMARY KEY,
    name TEXT,
    email TEXT,
    role TEXT
);

CREATE TABLE user_regions (
    user_id UUID REFERENCES users(user_id),
    region_id TEXT,
    PRIMARY KEY (user_id, region_id)
);
🌍 5. regions
CREATE TABLE regions (
    region_id TEXT PRIMARY KEY,
    name TEXT,
    boundary_polygon GEOMETRY -- optional if using PostGIS
);
🗃️ Cold Storage Format (Optional – S3)
Store historical sensor data as partitioned Parquet files:
Partition by:
region_id,date,hourSchema similar to
sensor_data
Use tools like Apache Spark or AWS Athena to query.
✅ Summary of Storage Roles
| DB / Storage      | Purpose                           | Tech Stack             |
| ----------------- | --------------------------------- | ---------------------- |
| Time-Series DB    | Hot recent data (7–14 days)       | TimescaleDB / InfluxDB |
| SQL DB            | Metadata, access control, configs | PostgreSQL             |
| Pre-aggregated DB | Heatmap tiles (1-min summaries)   | TimescaleDB or Druid   |
| Cold Storage      | Historical data (months/years)    | S3 + Parquet           |
🧱 Core Microservices & Responsibilities
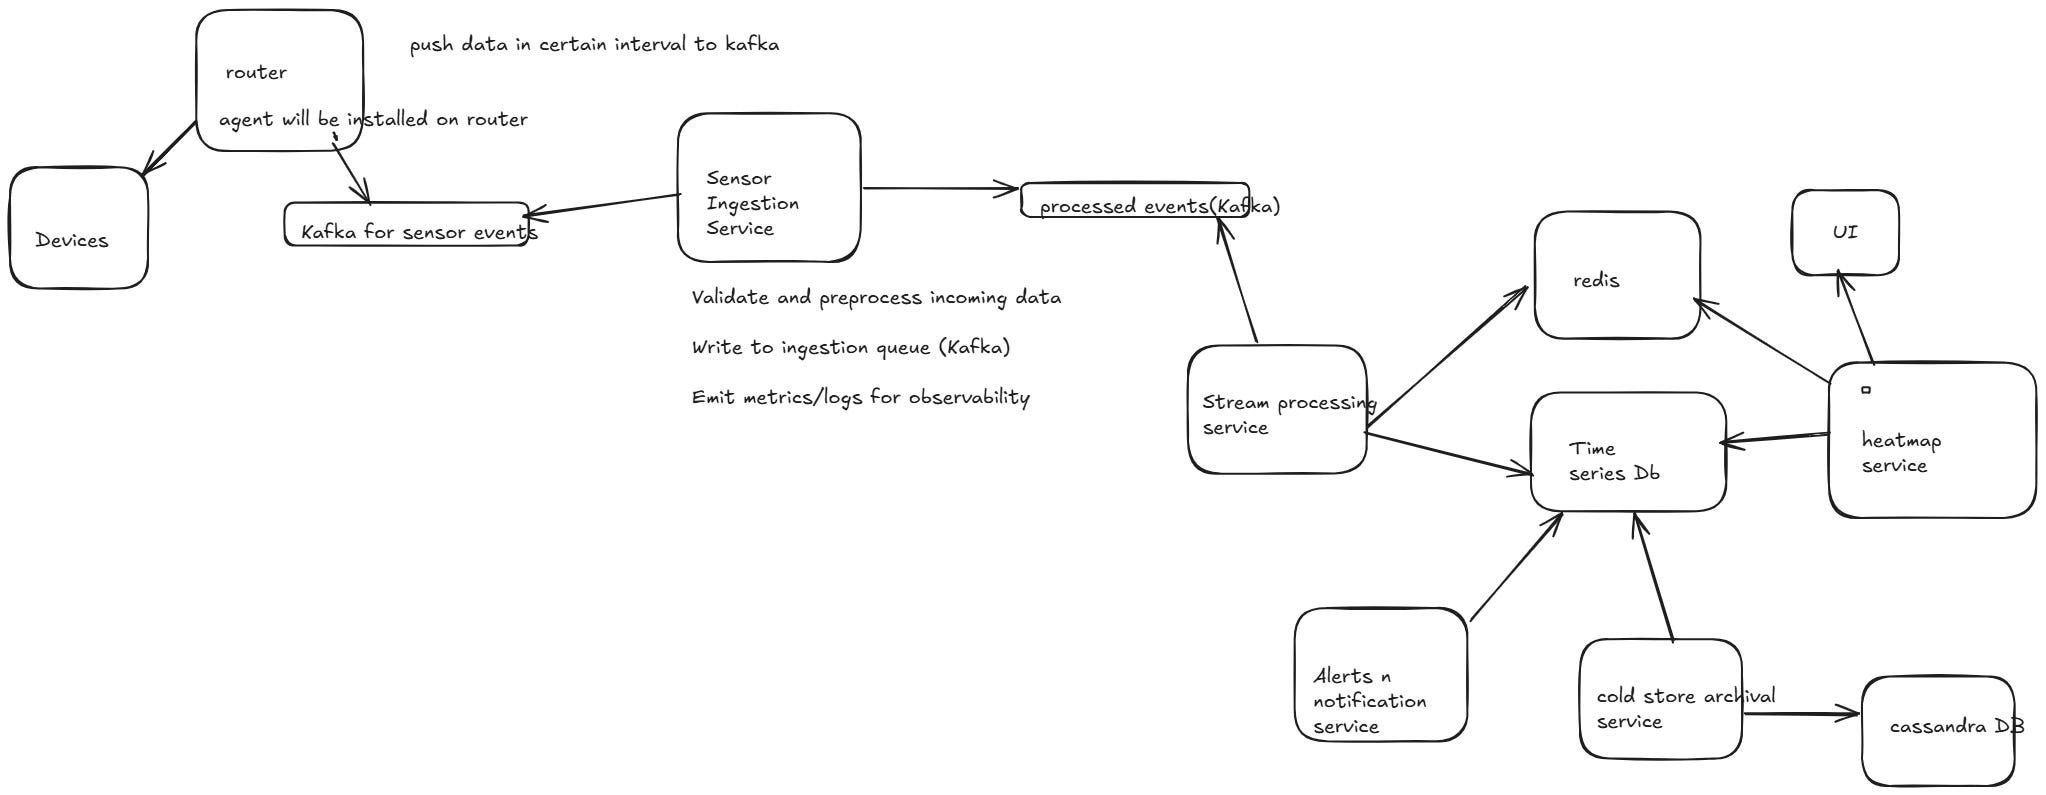
1. Sensor Ingestion Service
Purpose: Accepts data from 1M sensors (via REST, MQTT, Kafka, etc.)
Responsibilities:
Validate and preprocess incoming data
Write to ingestion queue (Kafka)
Emit metrics/logs for observability
Exposes:
POST /api/v1/sensors/data
2. Stream Processing Service
Purpose: Real-time aggregation of sensor data
Tech: Apache Flink / Kafka Streams / Spark Structured Streaming
Responsibilities:
Consume raw sensor events from Kafka
Aggregate by grid cell and time window (e.g., avg temp/soil_moisture)
Push data to
aggregated_tilesin time-series DBPush raw data to long-term cold storage asynchronously
3. Heatmap API Service
Purpose: Serves heatmap tiles and aggregates to UI/dashboard
Responsibilities:
Query
aggregated_tilesorsensor_databased on region/zoom/timestampServe heatmap overlays to frontend
Exposes:
GET /api/v1/heatmap/currentGET /api/v1/heatmap/history
4. Sensor Registry & Health Service
Purpose: Manage sensor metadata, health status, and diagnostics
Responsibilities:
Track sensor last-seen time, status (online/offline)
Monitor for faulty/battery-low sensors
Generate alerts
Exposes:
GET /api/v1/sensors/:id/statusGET /api/v1/sensors/:id/data
5. User Access & Region Service
Purpose: Manages user roles, access control, and farm/region data
Responsibilities:
Auth via OAuth/JWT
Serve region mappings & user permissions
Exposes:
GET /api/v1/users/me/regionsGET /api/v1/regions/:id
6. Cold Storage Archiver Service
Purpose: Periodically moves hot sensor data to S3
Responsibilities:
Batch query from
sensor_data(hot store)Transform into Parquet
Upload to partitioned buckets
Register new files in Hive/Glue Catalog
7. Alert & Notification Service
Purpose: Notify users about critical events (e.g., drought, sensor failure)
Responsibilities:
Listen to events (via Kafka or DB triggers)
Generate rules-based alerts
Notify via email/SMS/dashboard
8. Dashboard Frontend (Web/Mobile)
Purpose: Farmer-facing UI
Responsibilities:
Render heatmap overlays
Show sensor stats, trends, alerts
Fetch via
Heatmap API+Sensor Status API
🔄 Interaction Diagram
[Sensors] ─> [Sensor Ingestion Service] ─> Kafka ─> [Stream Processor]
                                                 └──> [Cold Archiver Service]
                                                 └──> [Sensor Health Service]

[Stream Processor] ─> [Aggregated Tiles DB (TSDB)]
                   └> [Sensor Data DB (raw, TSDB)]

[Heatmap API Service] <── Dashboard Frontend
                     └──> TSDB for recent data
                     └──> Cold Store (S3) for history

[Sensor Health Service] <── Dashboard Frontend

[User Access Service] <── Dashboard Frontend
                     └──> AuthN/AuthZ

[Alert Service] <── Kafka events
               └──> Notify users
🔐 Notes on Service Boundaries
| Service             | DB Access                          |
| ------------------- | ---------------------------------- |
| Sensor Ingestion    | No DB directly – Kafka only        |
| Stream Processor    | Kafka in, TSDB & Cold Store out    |
| Heatmap API Service | Aggregated Tiles DB, Cold Store    |
| Sensor Registry     | Sensor metadata store (PostgreSQL) |
| Access Control      | Users, regions DB (PostgreSQL)     |
| Cold Archiver       | Hot storage read, S3 write         |
| Alert Service       | Kafka + notification channels      |