
Summary of paper Dapper, a Large-Scale Distributed Systems Tracing Infrastructure
A Large-Scale Distributed Systems Tracing Infrastructure is a research paper that introduces Dapper, Google's system for tracing requests in large-scale distributed systems.

It provides insights into the architecture, challenges, and applications of tracing to diagnose performance issues and monitor system behavior.
Key Highlights:
Objective:
Dapper aims to trace requests end-to-end across distributed systems to provide visibility into how services interact, detect performance bottlenecks, and ensure system reliability.
Design Principles:
Low Overhead: Tracing should not significantly affect the system's performance.
Scalability: Must operate efficiently in Google's large-scale infrastructure.
Global Tracing: Provide a unified view of requests across multiple services.
Architecture:
Trace Spans: Dapper represents a request's journey as a series of spans, each corresponding to a unit of work in a service.
Trace ID and Span ID: Unique identifiers link spans and provide context for parent-child relationships.
Sampling: Only a subset of requests are traced to reduce overhead while still providing statistically meaningful data.
Annotations: Metadata like timestamps, error codes, or custom labels are attached to spans for deeper insights.
Implementation:
A lightweight Dapper library is integrated into Google's services to collect trace data.
The data is aggregated and stored in a backend system for analysis.
Integration with Google's monitoring tools allows visualization of traces and metrics.
Applications:
Performance Debugging: Identify bottlenecks or high-latency components in the request path.
Error Diagnosis: Trace root causes of errors or failures across services.
Capacity Planning: Understand resource utilization and predict scaling needs.
Challenges:
Maintaining low latency and minimal resource usage for tracing.
Ensuring accurate trace reconstruction in complex distributed environments.
Balancing trace fidelity with storage and processing costs.
Impact:
Dapper inspired modern distributed tracing tools like OpenTelemetry, Zipkin, and Jaeger.
It highlighted the importance of end-to-end visibility in distributed systems for effective monitoring and debugging.
1. The Problem Dapper Solves
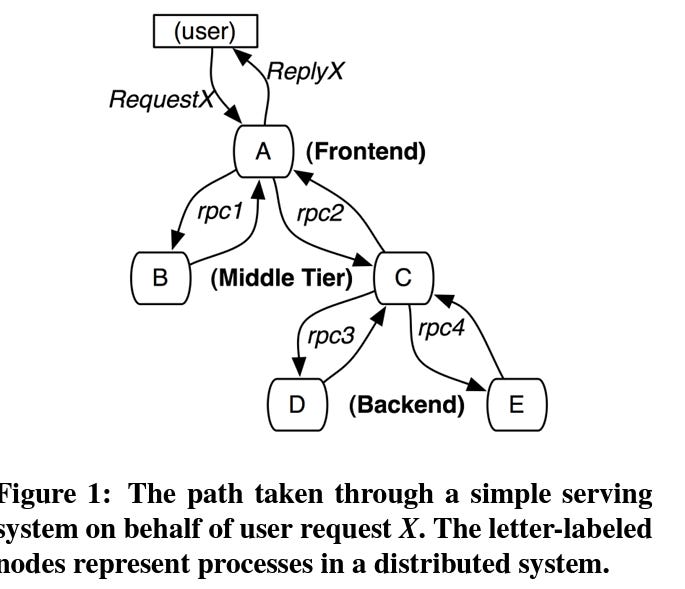
Modern distributed systems consist of hundreds or thousands of microservices and components working together. Debugging issues, tracking performance bottlenecks, and understanding interactions in such environments is challenging due to:
Decentralized Operations: Requests traverse multiple services.
Non-deterministic Execution: Components may execute in parallel or out of order.
Performance Bottlenecks: Identifying which service or interaction slows down the system.
Dapper addresses these challenges by tracing requests end-to-end across all services.
2. Core Concepts
Trace
A trace represents the journey of a single user request through the distributed system. It consists of multiple spans.
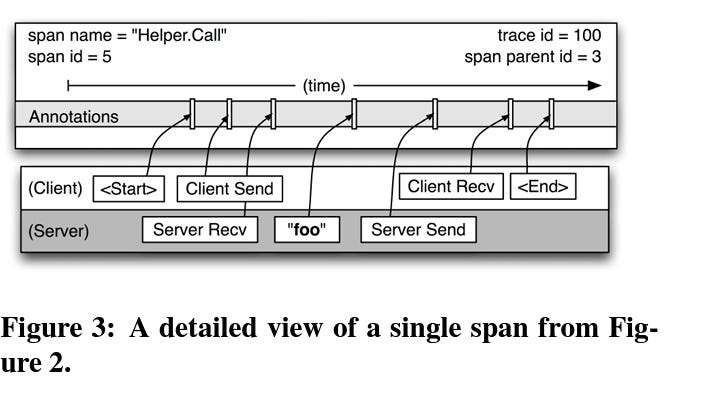
Span
A span represents a single unit of work performed by a service or component. Each span records:
Start and End Timestamps: To measure latency.
Operation Name: The action being performed.
Parent Span: Identifies the calling operation to reconstruct the request tree.
Annotations: Metadata such as error codes or custom tags.
Trace Context
Every request is tagged with a unique Trace ID.
Each span within the trace has a Span ID.
Services propagate these IDs through the system via headers or other mechanisms.
Sampling
To avoid overwhelming the system, Dapper traces only a fraction (e.g., 0.01%) of requests.
Sampling is deterministic, ensuring statistical significance for most use cases.
3. Architecture
Tracing Library
A lightweight Dapper library is embedded in services to instrument their operations.
It collects trace data with minimal overhead and injects trace context into outgoing requests.
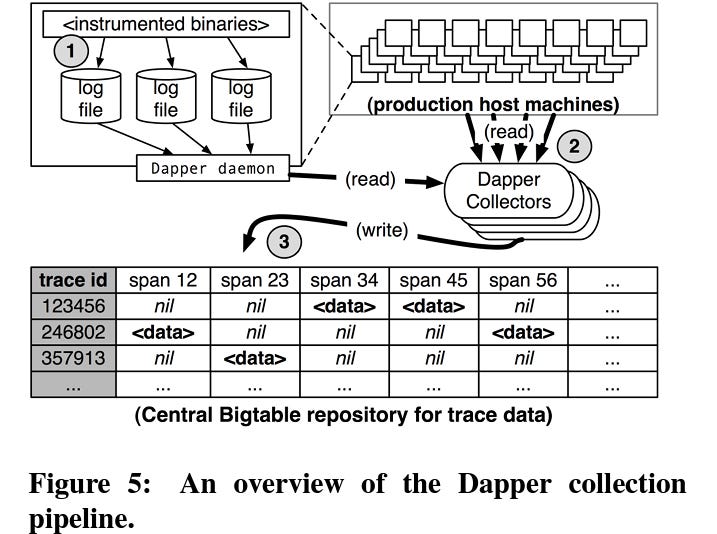
Trace Storage
Traces are written asynchronously to a centralized storage backend for durability.
Data is compressed and deduplicated to minimize storage costs.
Trace Visualization
A front-end interface allows developers to explore traces, analyze request latencies, and identify failures or bottlenecks.
Visualizations often include Gantt charts or tree-like structures showing service dependencies.
4. Sampling Strategy
Why Sampling?
Capturing all requests would generate enormous amounts of data, overwhelming storage and processing systems.
Approach
Sampling is performed upfront by the first service in the request chain.
Once a request is sampled, all subsequent spans for that request are also captured.
Ensures coherence and completeness of the trace.
5. Use Cases
Performance Debugging
Identify the slowest services or components in a request's path.
Analyze tail latency and optimize hotspots.
Error Diagnosis
Trace requests leading to failures to pinpoint the root cause.
Track down cascading failures in dependent services.
Service Dependency Analysis
Understand interactions between services and identify critical dependencies.
Discover undocumented APIs or unexpected call patterns.
Capacity Planning
Measure resource utilization for specific services.
Plan infrastructure scaling based on request patterns and latency.
6. Key Challenges
Low Overhead:
Dapper's instrumentation must not degrade system performance.
The sampling strategy ensures only a small percentage of requests are traced.
Accurate Reconstruction:
In distributed systems, partial failures or missing trace data can occur.
Dapper relies on consistent trace context propagation to rebuild traces.
Scalability:
Google-scale systems generate massive amounts of trace data even with sampling.
The storage and query systems are optimized for efficiency.
Dynamic Environments:
Services can scale up/down or be replaced, affecting trace continuity.
Dapper’s flexible context propagation accommodates such changes.
7. Real-World Examples from Dapper
Example 1: Debugging Latency
A user experiences slow responses from a web application.
A trace reveals that one service spends excessive time querying a database.
Developers optimize the database query, reducing latency significantly.
Example 2: Detecting Cascading Failures
A critical backend service crashes, affecting multiple dependent services.
Traces show how failures propagate, enabling quick identification of the root cause.
8. Influence on Modern Tools
Dapper’s ideas laid the foundation for modern distributed tracing systems, including:
Zipkin: Inspired directly by Dapper's design.
Jaeger: Built for cloud-native environments, supports OpenTelemetry.
OpenTelemetry: A vendor-neutral standard for telemetry collection.
9. Limitations
Statistical Sampling:
Rare events might be missed due to sampling.
Not ideal for debugging issues with very low occurrence rates.
Dependency on Instrumentation:
Requires services to be instrumented with the tracing library.
Legacy or third-party services might lack instrumentation.
Storage Costs:
Storing even a small percentage of trace data at Google scale can be expensive.
Summary of Impact
Google Dapper transformed the way large-scale distributed systems are monitored and debugged. It introduced core concepts such as traces, spans, and sampling that are now industry standards. By providing end-to-end visibility into request paths, Dapper enables developers to ensure the reliability and performance of modern distributed systems.
Tracer snippet from paper
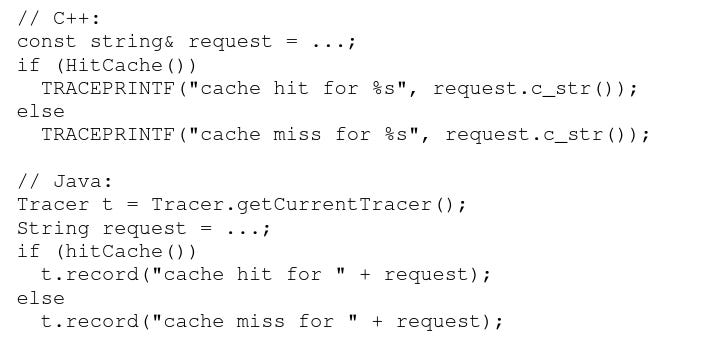
source :- from paper itself
Source :- from paper itself