
What is the difference between Prometheus and Influx
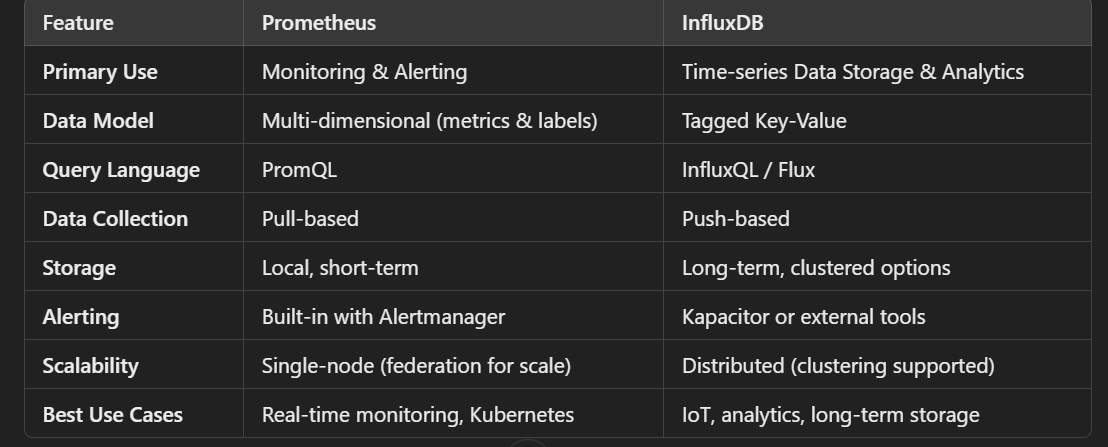
Prometheus and InfluxDB are both time-series databases, commonly used for monitoring and analytics. While they share similarities, they differ in their architectures, use cases, and focus areas.

1. Purpose
Prometheus:
Designed for monitoring and alerting.
Collects metrics from various sources (e.g., applications, servers, services) and provides real-time querying and alerting capabilities.
Primarily used in infrastructure and application monitoring.
InfluxDB:
Designed as a general-purpose time-series database for storing, querying, and analyzing time-series data.
Focused on handling large-scale data storage and analytics for IoT, DevOps, and real-time applications.
2. Data Model
Prometheus:
Stores metrics in a multi-dimensional data model.
Uses a key-value pair model where data is identified by a metric name and a set of labels (e.g.,
http_requests_total{status="200", method="GET"}).Best suited for structured metrics with labels.
InfluxDB:
Stores data in a tagged key-value structure with support for fields, tags, and timestamps.
More flexible for storing custom data types, raw events, and unstructured data.
3. Query Language
Prometheus:
Uses PromQL (Prometheus Query Language), which is optimized for querying and aggregating metrics.
Simple and effective for querying time-series data and building dashboards/alerts.
Example:
rate(http_requests_total[5m])
InfluxDB:
Uses InfluxQL (similar to SQL) and Flux, which are more general-purpose query languages.
Suitable for complex time-series analysis, joins, and advanced transformations.
Example (InfluxQL):
SELECT MEAN(value) FROM cpu WHERE time > now() - 1h GROUP BY host
4. Storage
Prometheus:
Uses its custom time-series database for storing metrics.
Stores data locally (but can integrate with remote storage backends).
Retention is limited by design (e.g., days or weeks of data) as Prometheus focuses on recent metrics.
InfluxDB:
Purpose-built time-series database.
Supports both local storage and distributed setups.
Designed to store and handle historical data efficiently with customizable retention policies.
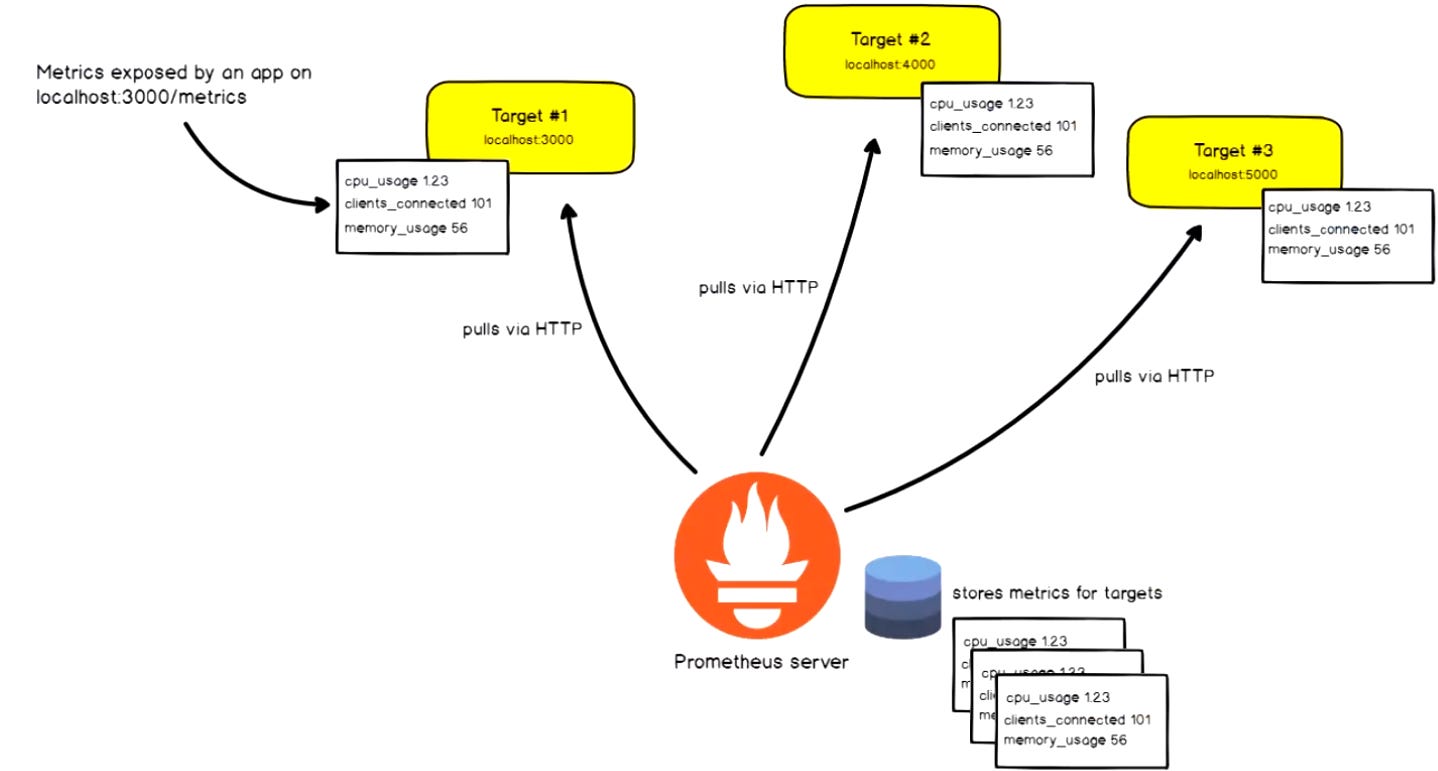
5. Data Collection
Prometheus:
Pull-based: Prometheus scrapes metrics from endpoints (e.g.,
/metrics).Relies on targets to expose metrics in a compatible format.
Works best with exporters and instrumented applications.
InfluxDB:
Push-based: Data is typically pushed into InfluxDB by Telegraf (a data collector) or custom client libraries.
Also supports pull-based ingestion via APIs and integrations.
More flexible for ingesting non-standardized data formats.
6. Ecosystem
Prometheus:
Comes with a rich ecosystem, including tools like Alertmanager for notifications and Grafana for visualization.
Part of the CNCF ecosystem and often used with Kubernetes, Docker, and service meshes.
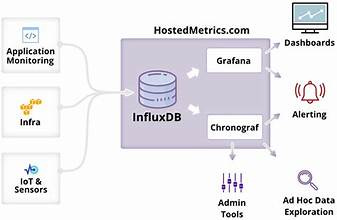
InfluxDB:
Part of the TICK stack: Telegraf (collector), InfluxDB (database), Chronograf (visualization), and Kapacitor (alerting/processing).
Flexible for various use cases like IoT, real-time analytics, and monitoring.
7. Scalability
Prometheus:
Designed for single-node setups, with horizontal scalability achieved using Prometheus federation.
Not ideal for storing large-scale or long-term data.
InfluxDB:
Supports clustered setups for horizontal scaling.
Handles larger volumes of data and longer retention periods more effectively.
8. Alerting
Prometheus:
Has built-in support for alerting rules.
Integrates with Alertmanager for advanced alerting workflows (e.g., deduplication, silencing, routing).
InfluxDB:
Relies on Kapacitor or external tools for alerting.
Supports more flexible alerting logic but requires additional setup.
9. Use Cases
Prometheus:
Best suited for real-time monitoring and alerting.
Ideal for infrastructure metrics, application performance monitoring (APM), and Kubernetes monitoring.
InfluxDB:
Suitable for long-term storage and analysis of time-series data.
Commonly used for IoT, sensor data, financial analytics, and DevOps monitoring.
10. Licensing
Prometheus:
Open-source (Apache 2.0 license).
Fully free to use and extend.
InfluxDB:
Open-source (MIT license) for the core, but advanced features (e.g., clustering) are part of the commercial version.
When to Use Which?
Choose Prometheus if:
You need real-time monitoring and alerting.
You prefer a pull-based metric collection system.
You are working in a Kubernetes or cloud-native environment.
Choose InfluxDB if:
You need a general-purpose time-series database for long-term storage.
You are handling large-scale IoT or analytics workloads.
You require advanced query capabilities and retention policies.

Both tools are excellent in their respective domains, and choosing between them depends on your specific requirements. For instance, you might even use Prometheus for monitoring and InfluxDB for historical analytics in the same architecture!
source:-wikipedia